Introduction
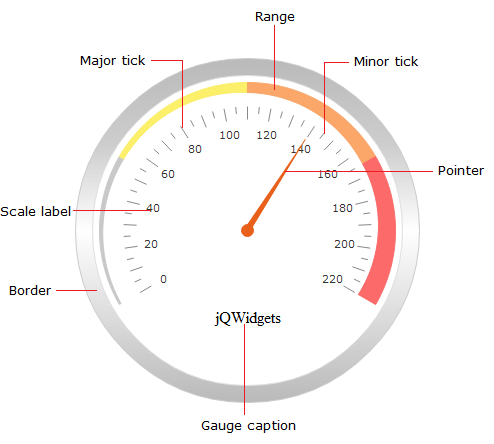
jqxGauge displays an indicator within a range of values. Gauges can be used in a
table or matrix to show the relative value of a field in a range of values in the
data region, for example, as a KPI. It automatically detects the browser capabilities
and uses SVG rendering with hardware acceleration (when available) in modern browsers
(IE9+, Firefox, Chrome, Opera) and VML rendering in IE8 and earlier browsers. The
ability to render both SVG and VML makes jqxGauge an ideal choice for your web sites
and applications. No browser plug-ins are required!
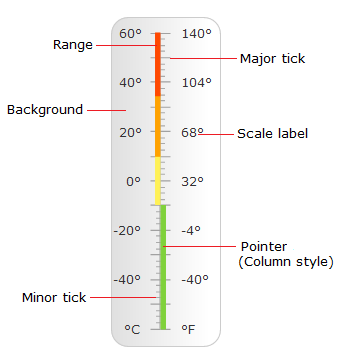
Linear Gauge
The Linear Gauge is another type of Gauge widget which can be displayed either horizontally
or vertically.